PRINCE2 2009 - Risk part 12
of the Cabinet Office under delegated authority from the Controller of HMSO.
The PRINCE2 approach
Risk management procedure
Assess
EstimateThe primary goal of the ‘Estimate’ step is to assess the threats and the opportunities to the project in terms of their probability and impact.
The risk proximity will also be of interest to gauge how quickly the risk is likely to materialize if no action were taken.
PRINCE2® recommends that the following is understood:
- The probability of the threats and opportunities in terms of how likely they are to occur
- The impact of each threat and opportunity in terms of the project objectives. For example, if the objectives are measured in time and cost, the impact should also be measured in units of time and cost
- The proximity of these threats and opportunities with regard to when they might materialize
- How the impact of the threats and opportunities may change over the life of the project.
Risks can be estimated using a number of techniques, such as:
Probability trees
These are graphical representations of possible events resulting from given circumstances.
A probability tree can be used to predict an outcome in a qualitative way when historical data is used to populate the likelihood of each circumstance happening.
Probability trees assist in communicating to project participants or decision makers the likelihood of the different possible outcomes to a set of circumstances.
Expected value
This technique quantifies risk by combining the cost of the risk impact with the probability of the risk occurring.
Expected value is useful when a tangible measure of risk is required to enable risks to be prioritized.
For example, if the cost of a risk was £160,000 and its likelihood of occurrence was estimated at 25%, then the expected value would be £40,000.
Pareto analysis
This technique ranks or orders risks once they have been assessed to determine the order in which they should be addressed.
Pareto analysis can be used to focus management effort on those risks that have the potential to have the greatest impact on the project objectives
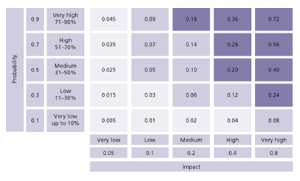
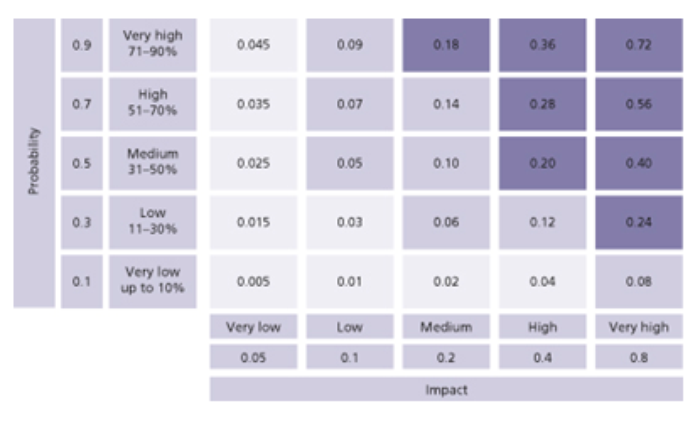
Probability impact grid
This grid contains ranking values that may be used to rank threats and opportunities qualitatively.
The probability scales are measures of probability derived from percentages, and the impact scales are selected to reflect the level of impact on project objectives.
The values within the grid cells are the combination of a particular probability and impact, and are determined by multiplying the probability by the impact.
A probability impact grid can be used to provide an assessment of the severity of a risk and enable risks to be ranked so that management time [see 'The Complete Time Management package'] and effort can be prioritized.
For example, the Project Board may set their risk tolerance at any risk with a value of greater than 0.18, and they may require a proactive response for any risk with a value of greater than 0.045, as depicted by the dark shading shown in diagram 1.
© Crown copyright 2005 Reproduced under licence from OGC
Diagram 1
A useful way of summarizing the set of risks and their estimations is to plot them onto a summary risk profile, an example of which is shown in diagram 2.
© Crown copyright 2005 Reproduced under licence from OGC
Diagram 2
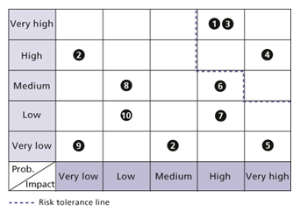
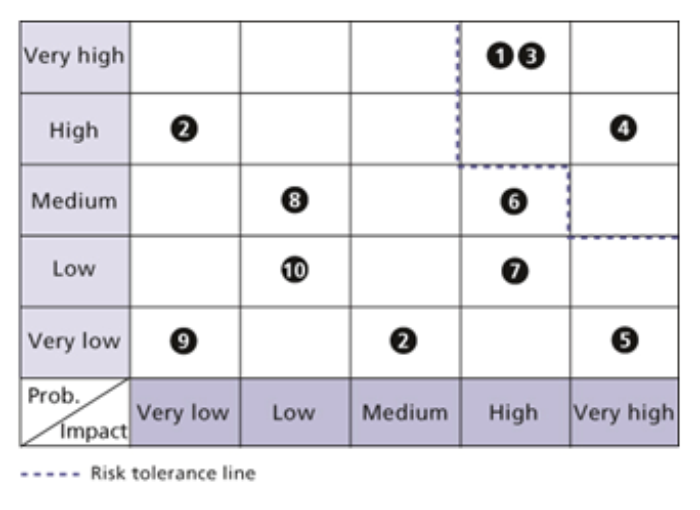
The numbered markers in the matrix represent unique risk identifiers used in the Risk Register on which this is based.
The risks above and to the right of the dotted risk tolerance line represent those that the organization will not tolerate except under special circumstances.
In the depicted case, the Project Manager would refer risks 1, 3 and 4 to the Project Board.
The summary risk profile can also be used to show trends.
For example, risk 6 may have previously been recorded as ‘low probability, high impact’, indicating that its likelihood of occurring is increasing.
The primary goal of the ‘Evaluate’ step is to assess the net effect of all the identified threats and opportunities on a project when aggregated together.
This will enable an assessment to be made of the overall severity of the risks facing the project, to determine whether this level of risk is within the risk tolerance set by the Project Board and whether the project has continued business justification.
Risks can be evaluated by using techniques such as:
Risk models
Take, for example, the Monte Carlo analysis.
This model enables simulation of ‘what if’ scenarios using random numbers to determine whether each risk within a given range occurs or not.
The simulations are repeatedly run to predict the ‘average’ level of risk to the project’s time or cost.
The scenarios can also be used to model extreme cases (e.g. if nearly all the risks occur)
Expected monetary value
This technique takes the expected values of a number of risks and sums them to arrive at an overall value.
It provides a quick and easy assessment of a group of risks to understand their combined effect.
An example is shown in the table below.
| Risk ID | Likelihood (%) | Impact (£) | Expected value (£) |
|---|---|---|---|
| 1 | 60 | 20,000 | 12,000 |
| 2 | 30 | 13,000 | 3,900 |
| 3 | 10 | 4,000 | 400 |
| 4 | 5 | 10,000 | 500 |
| Expected monetary value | 16,800 | ||
Risk management is a large area and is covered in depth in ‘The Complete Risk Management package’.
PRINCE2® is a Registered Trade Mark of the Office of Government Commerce in the United Kingdom and other countries.
Managing Successful Projects with PRINCE2 - 2005 edition
Managing successful Projects with PRINCE2 – 2009 edition
Directing Projects with PRINCE2.
plus:
The Complete Project Management package.
And much more besides - at a fantastic price.