Risk management - Evaluate - positive correlation
The Risk Management process
EVALUATE - positive correlation
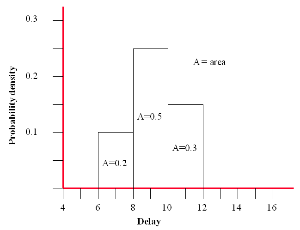
As previously [see The Risk Management process - Evaluate - independent correlation], let us assume an identical probability distribution for both activity ‘A’ and ‘B’ with probabilities for values 7, 8 and 9 weeks delay of 0.3, 0.5 and 0.2.
| Delay | Probability |
|---|---|
| 7 | 0.3 |
| 9 | 0.5 |
| 11 | 0.2 |
The combination of activities ‘A’ and ‘B’ in ‘positive dependence’ mode will only give values of 14, 18, and 22.
| Delay | Probability |
|---|---|
| 14 | 0.3 |
| 18 | 0.5 |
| 22 | 0.2 |
Note: The probabilities do not change. This is because with perfect positive correlation we will always get 7 + 7, 9 + 9 and 11 + 11.
Even if we combined 100 activities the result would be the same.
| Delay | Probability |
|---|---|
| 700 | 0.3 |
| 900 | 0.5 |
| 1100 | 0.2 |
Positive correlation occurs when there is an underlying factor which is common to two or more activities.
For example, for the probability estimation of activities ‘A’ and ‘B’.
- A similar market drivers may drive costs for both activities.
- The same person may have derived estimates for both activities.
- The same person or contractor may be driving the key issues in both activities.
In general, because of these sort of factors positive dependence is often considered more realistic than the independent model.
The level of dependence can be represented by the percentage of correlation. Where 0% correlation equates to ‘independence’ and 100% equates to full positive correlation.
The Cumulative Probability graph is shown next [see Cumulative probability graph].


