Risk management - Uncertain events part 3
Uncertain events part 3
Continuing the earlier example [see Uncertain events part 2].
The range of costs for a pump might be:
| MINIMUM | = £1,000 |
| MAXIMUM | = £1,500 |
| LIKELY | = £1,250 |
One pathway (pathway B, 70%) could be that the project requires a total of 10 pumps.
At £1000 per pump (minimum cost).
The range of costs could be:
| MINIMUM | = £10,000 |
| MAXIMUM | = £15,000 |
| LIKELY | = £12,500 |
We judge there is a 70% likelihood that this will happen.
This is indicated by the first ‘triangular distribution’.
If we decide there is a possibility that we may need an additional 5 pumps (pathway C, 30%) the cost would be:
| MINIMUM | = £15,000 |
| MAXIMUM | = £22,500 |
| LIKELY | = £18,750 |
We judge there is a 30% likelihood that this will happen.
This is indicated by the second ‘triangular distribution’.
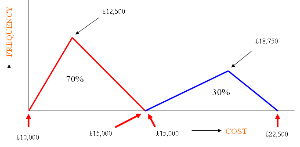
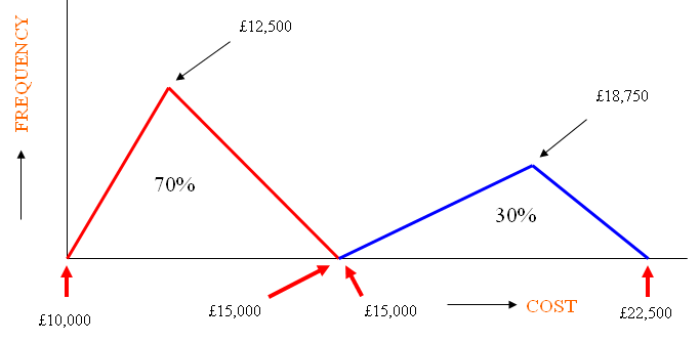
So, the total cost could be represented by the above graph as:
| MINIMUM | = £10,000 (pathway B) |
| MAXIMUM | = £22,500 (pathway C) |
The peaks represent the LIKELY total cost for pathway B only of £12,500 or for pathway C which has a LIKELY cost of £18,750.
RISK software can take into account these multiple pathways calculating random values for each whilst taking into account the likelihood of each one occurring.
You need to consider other aspects of RISK pathways.