Risk management - Monte Carlo distribution
Monte Carlo distribution
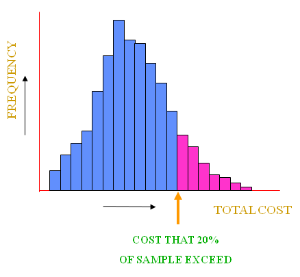
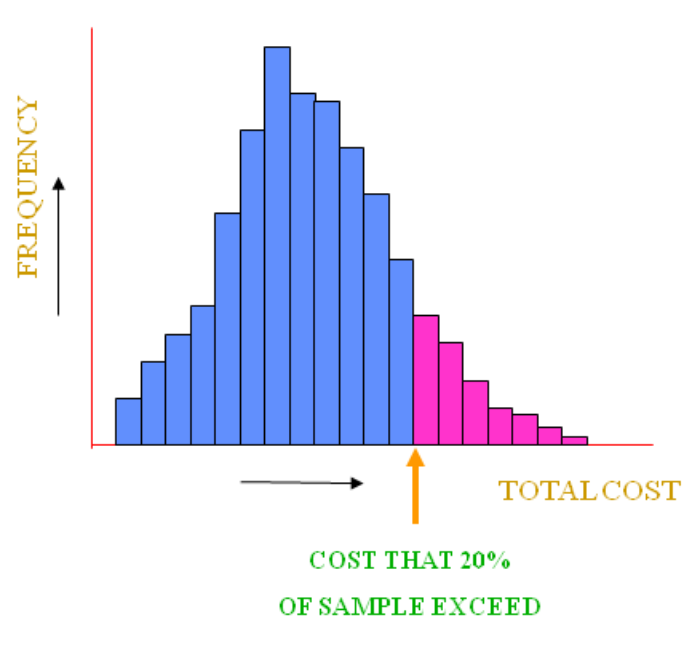
The above diagram shows us how the histogram equates risk.
The histogram represents, in this case, a total of 1000 simulations. Each column shows how many simulations occurred for each ‘total cost’ range.
If these are totalled they will add up to 1000.
If we indicate (by the arrow) where a total of 800 simulations occur we can assess the ‘total cost’ at this point.
Based on the example above this would be £120,000 to £130,000 (assumes the range of total costs was 0 to £200,000, had the start been at £50,000 this value would have been £170,000 to £180,000)
Hence, we can see that there is an 80% (800 out of 1000) chance of the ‘total cost’ NOT EXCEEDING £130,000. So, there is a 20% risk that the project will exceed £130,000.
Seen another way, for every 1000 simulations it is likely that 800 of them will have a ‘total cost’ vale of less than £130,000.
So this histogram, taking 1000 simulations can be used as a prediction of what could happen in real life.
It can indicate RISK.