Risk management - Business profit simulation
Business profit simulation
Simulation
The spreadsheet simulation will carry out perhaps 300 to 1000 iterations.
For each iteration and for each Opportunity a value will be set for the START and DURATION fields within their MINIMA and MAXIMA.
In addition, a value will be set for the REVENUE and PROFIT MARGIN between their MINIMA and MAXIMA.
With this data profits will be calculated for each Opportunity and summarised for the year end.
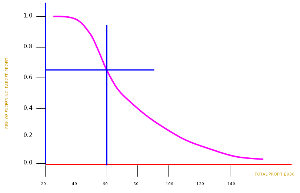
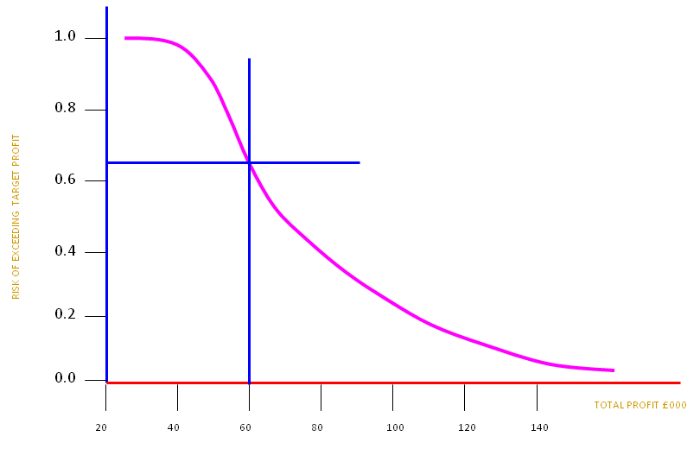
This final value is recorded and represented in a graph as above.
This is similar to others we have seen earlier for cost and schedules [see Budget vs Contingency] and [see Budget vs Contingency part 2].
However, it differs in that we are looking for a PROFIT value with a good chance of being EXCEEDED.
(In the case of the cost and schedule models we were looking for a value that had a good chance of not being exceeded.
Typically, we would set the cost or schedule duration at the 20% level of being exceeded).
So, we can set a profit target at £60,000 which has approximately a 65% chance of being exceeded.