Risk management - Monte Carlo simulation part 2
Monte Carlo simulation part 2
We clearly can not run a project several thousand times in order to assess the true variability of the total cost and duration.
What we can do is mimic this by running computer based simulations where each simulation chooses a random value for each activity.
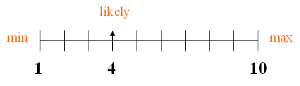
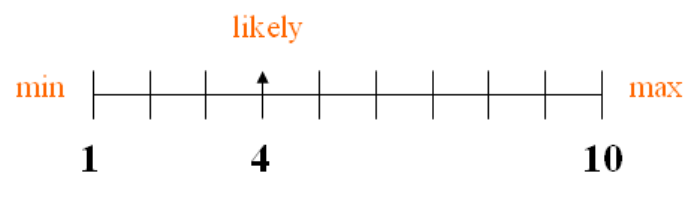
So, for each of the activities we need to generate a random value.
That value will be within its designated range and be realistic.
All of these ‘random values’ are added to achieve a total unique value for the project.
Let’s call this total = A
We then repeat this operation for another randomly produced set of values and add them up again.
Let’s call this total = B
We then need to repeat this many times to get a view on how the total value behaves for given sets of values for the individual activities.
As mentioned previously, we could do this by carrying this out for all of the known combinations, which would be way too difficult and unnecessary.
By carrying this out for a certain smaller number of calculations we can get a perfectly good idea of the distribution of total values.
Typically, you need about 1000 calculations. 300 is probably a little to few.
This will produce a histogram of the possible total cost values, [see Monte Carlo simulation output].